Ah, the corporate dashboard—once solely the domain of CEOs and department heads, tracking everything from quarterly sales figures to employee productivity.
Traditionally, these dashboards have been the go-to tool for businesses striving to stay data-driven and goal-oriented. Whether it’s performance metrics, revenue growth, or customer satisfaction scores, dashboards have long served as the Swiss army knife of corporate analytics—efficient, reliable, and functional.
But let's face it, outside the world of boardrooms and strategy meetings, they’ve often had a reputation for being, shall we say, a little dry.
Surprisingly, KPI dashboards aren’t just thriving in corporate settings—they’re also making a big impact outside the business world. Creative and resourceful individuals have discovered new ways to put them to work. Charities, conservationists, and community organizations are leveraging dashboards to track outcomes and make data-driven decisions in innovative and meaningful ways. The flexibility of dashboards is helping solve real-world problems in unexpected areas.
Here’s a look at 10 lesser-known, yet powerful, uses for the humble KPI dashboard:
1. Charities Using Dashboards to Support Alcohol Recovery
Some addiction recovery charities are now using dashboards to track the well-being of individuals struggling with alcohol dependency. Far from just recording clinical data, these dashboards visualize emotional, physical, and mental health indicators. Sleep patterns, mood logs, and counseling sessions—all of it comes together on one screen to help caseworkers and individuals alike see trends and make more informed decisions about treatment paths. What used to be a static report now becomes a living, breathing roadmap to recovery.
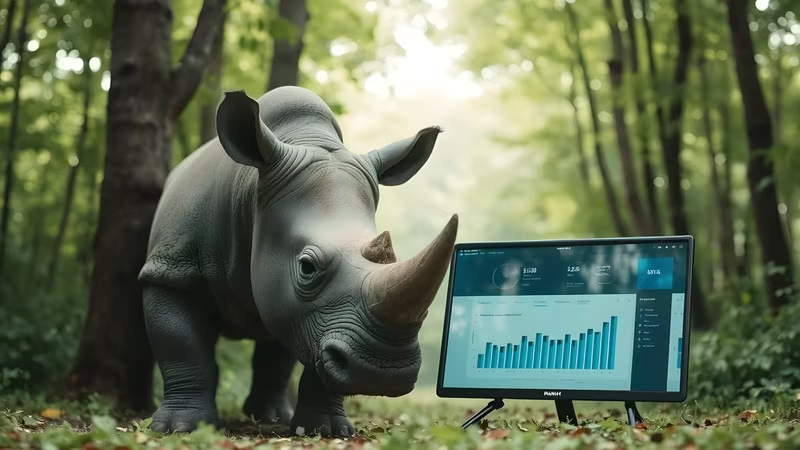
2. Animal Conservation and Wildlife Monitoring
Another inspiring example comes from wildlife conservation efforts, where dashboards are used to monitor the health and movement of endangered species. Conservationists can visualize animal migration patterns, heart rates, and environmental threats all from a single interface. GPS tracking devices, health metrics, and local environmental data flow into these dashboards, empowering conservation teams to act quickly when something seems off. The result? Real-time decision-making that could mean the difference between saving a species or watching it teeter on the brink of extinction. Learn how organizations like WWF are using dashboards to track endangered species and protect wildlife.
3. Homelessness Prevention: Using Dashboards to Allocate Resources
Think KPI dashboards are just about profit margins? Think again. Some forward-thinking cities and nonprofits are using dashboards to address homelessness. These dashboards track shelter occupancy rates, food distribution efforts, and access to mental health services, ensuring that resources are deployed effectively. Rather than relying on guesswork, organizations can make informed, data-driven decisions to better serve vulnerable populations. Los Angeles and Community Solutions provide real-world examples of how dashboards are helping cities and nonprofits tackle homelessness, making responses faster and more efficient.
4. Mental Health Support for Remote Workers
The surge in remote work has brought about its own set of challenges, particularly around mental health and well-being. Some organizations have started using dashboards to track the emotional and psychological state of their remote teams. These well-being dashboards allow employees to anonymously log mood levels, stress factors, and overall mental health indicators. With the data aggregated into a clear visual format, HR teams can identify patterns and step in with support before burnout becomes an issue.
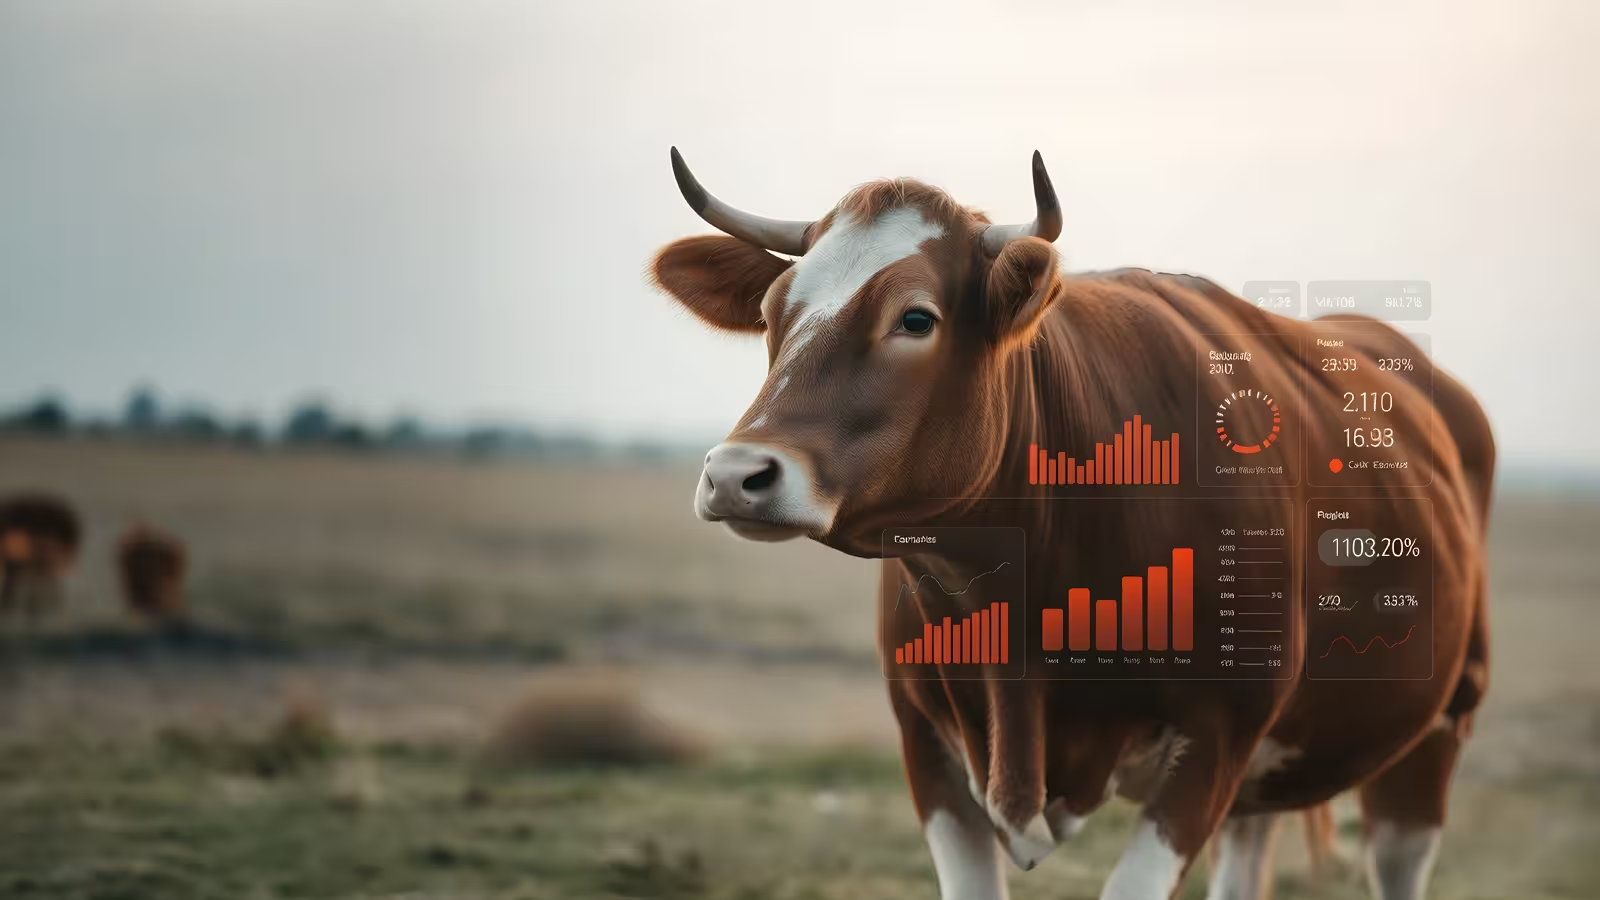
5. Farming Meets Data: Livestock Welfare Monitoring

In yet another creative twist, farms focused on humane practices are using dashboards to monitor the well-being of their animals. From feeding schedules to health diagnostics, everything a farmer needs to ensure the welfare of their livestock is tracked and visualized. This not only makes it easier to manage large farms but also ensures that ethical standards are upheld, giving consumers more confidence in the products they purchase.
6. Dashboards for Urban Farming and Community Gardens
Community organizations are even using dashboards to monitor the progress of urban gardens. These dashboards track plant growth, soil quality, and even community participation in local gardening efforts. The data helps coordinators optimize crop yields and improve engagement, turning community gardens into thriving urban ecosystems.
7. Disaster Relief Coordination and Response
In times of crisis, speed and organization are key. Dashboards are being used by relief organizations to monitor disaster areas, track resource allocation, and coordinate response efforts in real-time. These dashboards display live data on shelter capacities, food supplies, medical resources, and the movement of emergency personnel, allowing responders to act quickly and efficiently. By visualizing this information, relief teams can prioritize high-need areas and ensure that help is deployed where it's needed most.
8. Education: Tracking Student Performance and Engagement
Schools and educational institutions are using KPI dashboards to track student performance, attendance, and engagement. Rather than relying solely on grades, these dashboards incorporate data from participation in extracurricular activities, assignment completion rates, and even student well-being indicators like sleep patterns or emotional health logs. Educators can use this data to identify at-risk students and offer targeted support before academic struggles become insurmountable. Explore how the Ed-Fi Alliance is using dashboards to transform education with data-driven insights.
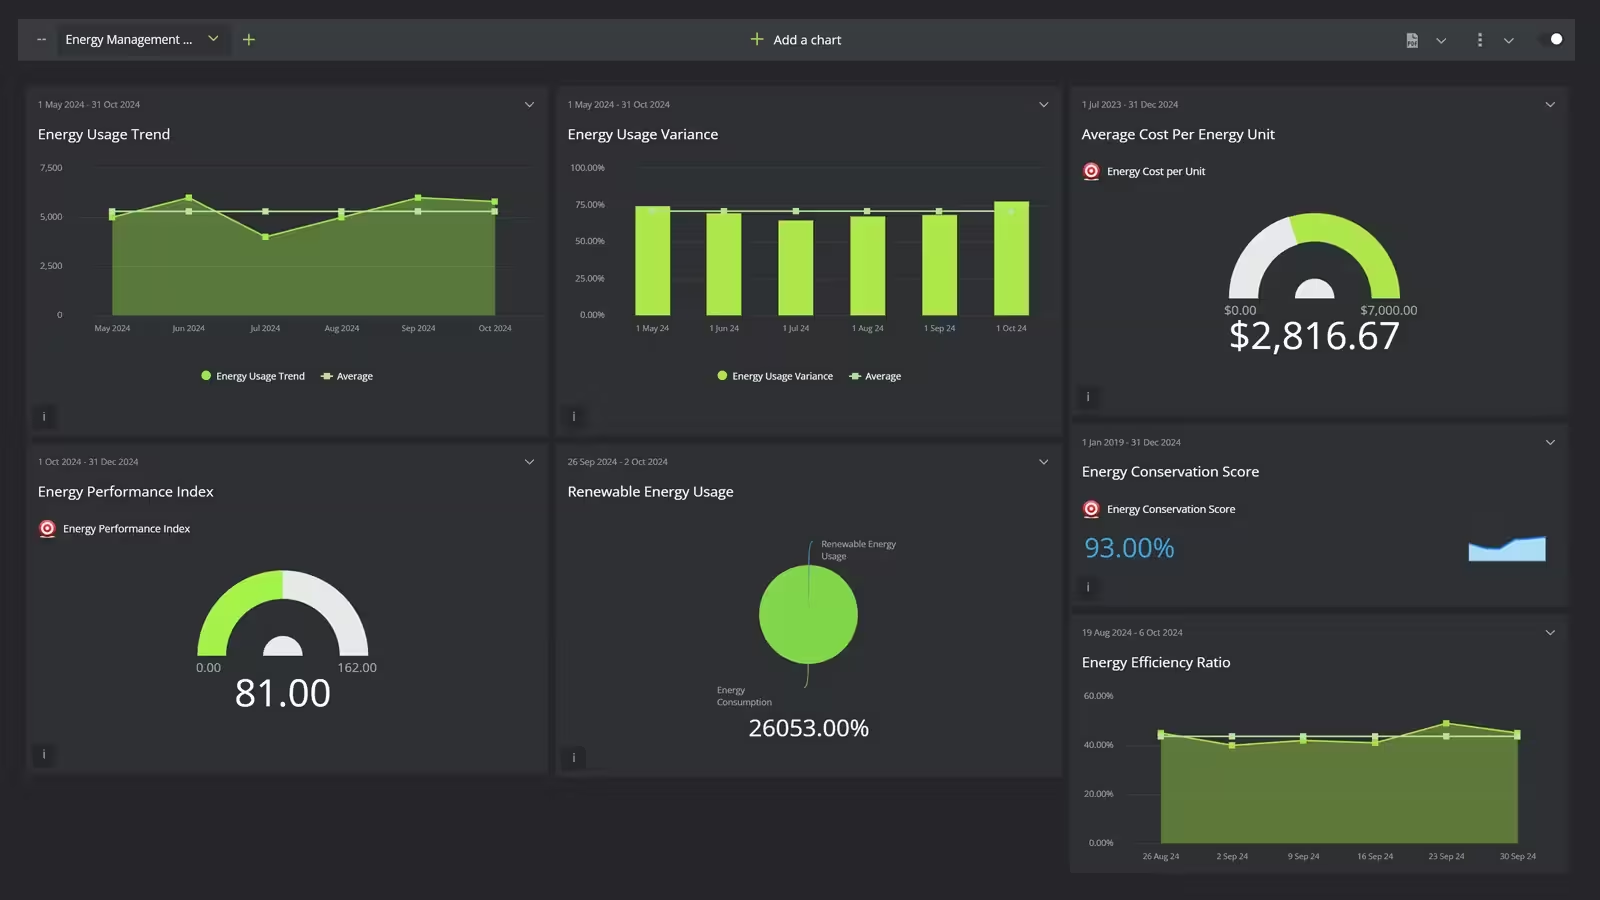
9. Environmental Sustainability Monitoring

Organizations focused on sustainability are using dashboards to track energy usage, water consumption, and waste reduction initiatives. These energy management focused KPI dashboards provide visual insights into how sustainable practices are affecting the environment, whether at a corporate or community level. Businesses can monitor carbon emissions, while cities track recycling rates and water conservation efforts. The data helps pinpoint inefficiencies and promotes accountability for environmental goals.
10. Public Health Tracking for Disease Prevention
Public health organizations are using dashboards to monitor disease outbreaks and vaccination rates. By visualizing data from hospitals, clinics, and labs, they can quickly spot trends and respond to potential health crises before they escalate. These dashboards help track infections, treatment outcomes, and resource availability in real-time, enabling more effective public health interventions and rapid responses to emerging threats. The Johns Hopkins University COVID-19 dashboard has been an influential example of how public health dashboards can track disease prevention and outbreaks.
Where Next? The Future of KPI Dashboards Outside the Corporate World
As dashboards continue to flourish in non-corporate sectors, we can only imagine where they’ll be applied next. The possibilities seem endless: art therapy programs monitoring emotional progress, or even public health efforts using dashboards to predict and prevent the spread of diseases.
What’s clear is that dashboards are no longer just about profit margins and sales targets. They’ve broken free from the confines of the corporate office and are being used to make a real, tangible difference in people's lives. Whether it’s monitoring the health of endangered species, improving the well-being of individuals struggling with addiction, or optimizing resources for the homeless, KPI dashboards have found a new calling—and the world is better for it.

by Stuart Kinsey
Stuart Kinsey writes on Key Performance Indicators, Dashboards, Marketing, and Business Strategy. He is a co-founder of SimpleKPI and has worked in creative and analytical services for over 25 years. He believes embracing KPIs and visualizing performance is essential for any organization to thrive and grow.
