DYNAMIC, FLEXIBLE, SCALABLE
Things you'll love about KPI Dashboards
The easiest KPI Dashboard
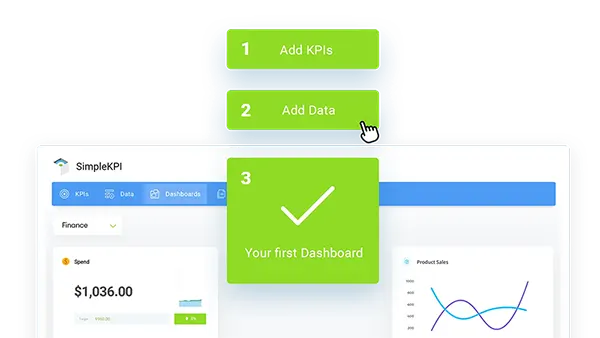
Generating your first KPI Dashboard is a simple as it gets. Create some KPIs (or use the library), connect your data and get a customizable dashboard ready to go.
Then generate as many dashboards as you like for individuals, teams or the entier organization.
Dashboards you'll want to share
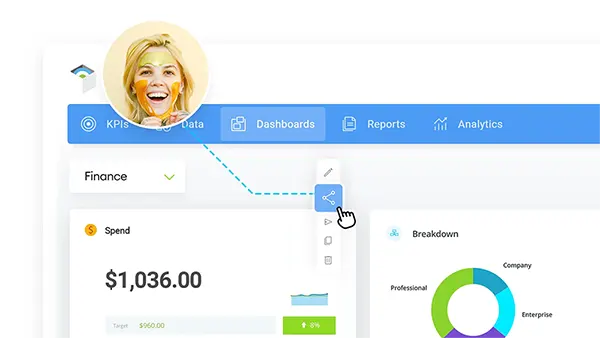
Create and share your Key Performance Indicators with colleagues and clients. Have a single, transparent and accurate version of the data for everyone.
Start sharing dashboardsIntegrate your data from everywhere
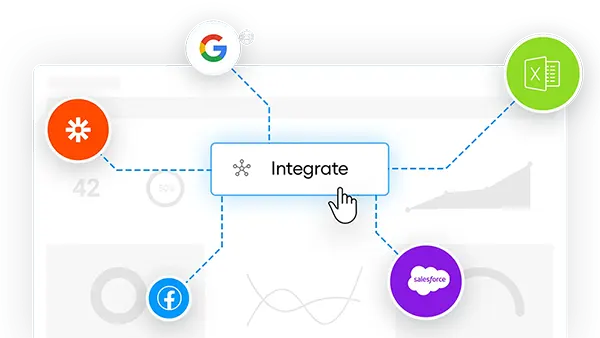
With SimpleKPI, you can effortlessly integrate data from spreadsheets, databases, and other online applications into your own dashboards.
Customize to your heart's content
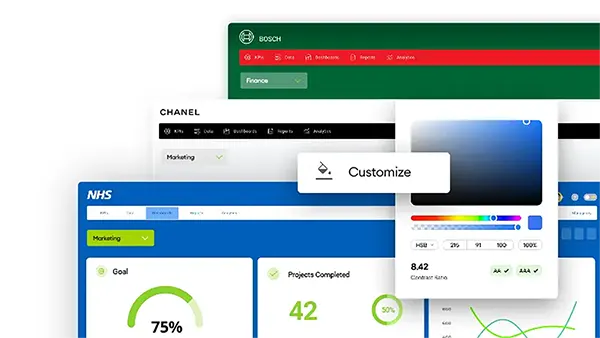
Build your dashboards to your corporate brand, etc
Start customizing your dashboardComprehensive KPI Dashboard Features
- Over 40 different graphs and chart types
- Share both internally and publicly
- Embed individual KPI charts on your website
- Full screen mode and presentation looping
- Connect your data to almost any app
- Customize nearly every aspect to suit your brand
- Professional KPI Dashboard Examples
The benefits of KPI Dashboard Software
- Track progress: KPI dashboards help organizations monitor their progress towards specific metrics and goals.
- Graphical summary: They provide a top-level graphical summary of core business objectives or departmental targets.
- At-a-glance analysis: KPI dashboards allow users to more efficiently track general progress towards set goals, analyze potential trends, and make more informed data-driven decisions.
- Interactive data visualization: With supporting charts and tables, KPI dashboards enable users to compare and understand the detail behind the numbers.
- Consolidate essential data: KPI dashboards consolidate a company’s most essential operational data in one location, assisting in eliminating data silos and boosting efficiency in assessing performance, establishing goals, and optimizing user workflows.
A KPI dashboard is a tool that displays key performance indicators (KPIs) in interactive charts, graphs, and gauges, enabling quick and efficient monitoring and analysis. Modern KPI dashboards empower users to effortlessly delve into the data behind the KPIs and reveal actionable insights. In this way, a KPI dashboard can transform large data sets across an organization into insights for data-driven decision-making.
Creating a KPI Dashboard involves 5 basic steps:
- Define your key performance indicators: Identify the metrics that are most important to your business objectives.
- Select your data sources: Collect data from spreadsheets, databases, and other online applications.
- Understand the intended audience: Determine who will be using the dashboard and what information they need to see.
- Build your dashboard with meaningful and straightforward graphs: Use interactive charts and graphs to display your KPIs in a clear and concise manner.
- Share the dashboard: Make sure your KPI dashboard is accessible to all relevant stakeholders.
KPI Dashboards can be displayed directly on monitors via an internet enabled TV. The dashboards can also be set to rotate between multiple dashboards.
Yes, there are over 40 industry specific dashboards ready to use. These includes dashboards for various manufacturing, production, marketing, sales functions within specific industries.
