Up and running in minutes with three simple steps:
1 Add your KPIs
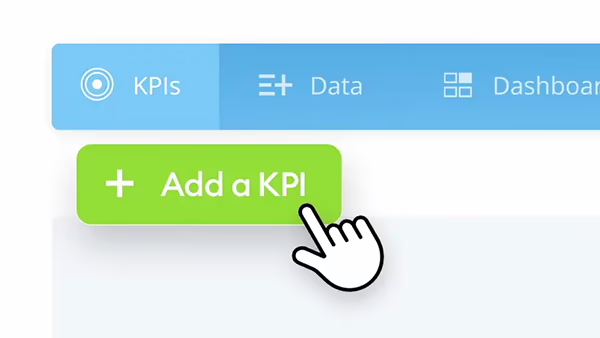
Create KPIs from scratch, import via spreadsheets, or choose from predefined templates and libraries.
2 Add your data
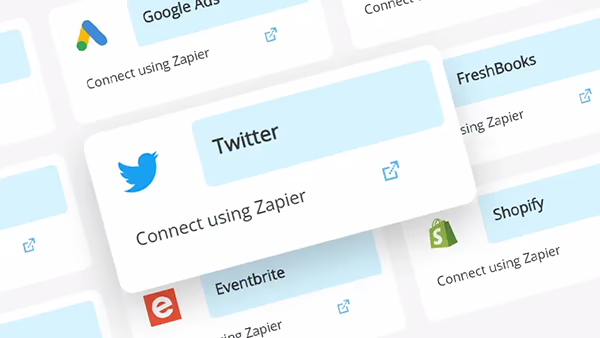
Add your data via spreadsheets, automatically link to your data sources, or even manually input.
3 Create your Dashboards
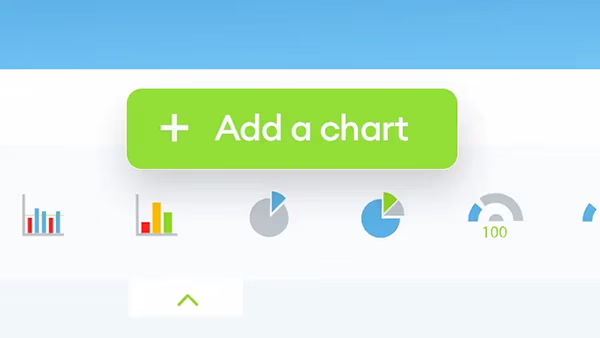
Select from predefined dashboards, or build your own with drag-and-build charts and graphs.
SimpleKPI Getting Started Guide
Welcome to SimpleKPI, the ultimate KPI tracking software solution for your business. Whether you want to measure your sales, marketing, customer service, or any other aspect of your performance, SimpleKPI can help you create, visualize, and share your key performance indicators with ease.
In this guide, we will walk you through the basics of SimpleKPI and show you how to get started in minutes. Let's begin!
How to get started with SimpleKPI
1. How to sign up for a free trial
To start using SimpleKPI, you need to sign up for a free trial account. You only need to provide a business email and password, and there is no requirement for a credit card. Your free trial will last for 14 days, and you can cancel anytime.
2. How to set up your first KPI
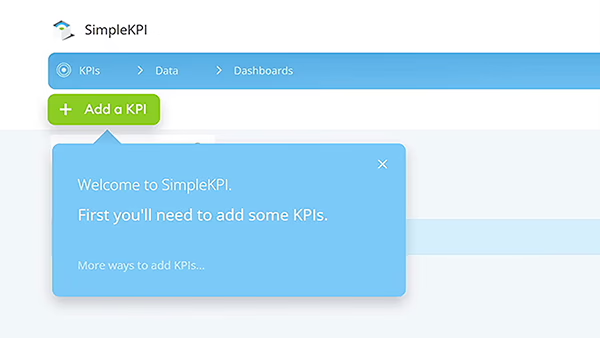
When you first log in to SimpleKPI, you will be greeted by a walkthrough wizard that will help you set up your first KPI. A KPI is a measurable value that shows how effectively you are achieving your business objectives.
To create your first KPI, follow these steps:
- Enter a name for your KPI, such as "Sales Revenue" or "Customer Satisfaction".
- Choose a frequency for your KPI, such as daily, weekly, monthly, or annually.
- Enter a target value for your KPI, such as $10,000 or 90%.
- Click on "Save".
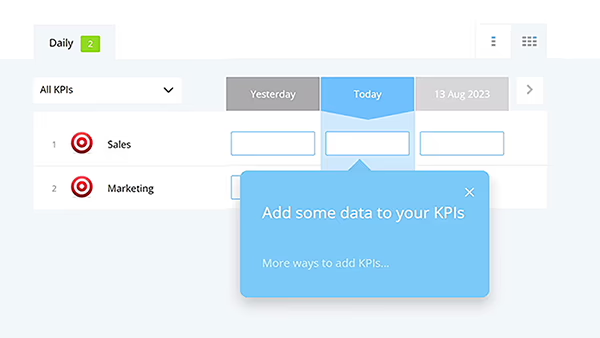
3. How to add data to your KPI
After creating your first KPI, you need to add some data to it. You can do this in several ways:
- Manually enter the data via a spreadsheet-like interface.
- Upload a spreadsheet file from your computer.
- Link automatically via Google Sheets or other software products that integrate with SimpleKPI.
- Choose from the predefined data sources that SimpleKPI offers.
To add data to your KPI, follow these steps:
- Select the method that suits you best from the options on the screen.
- Choose a frequency for your KPI, such as daily, weekly, monthly, or annually.
- Follow the instructions on how to connect or upload your data source.
- Click on "Next".
4. How to build your first KPI dashboard
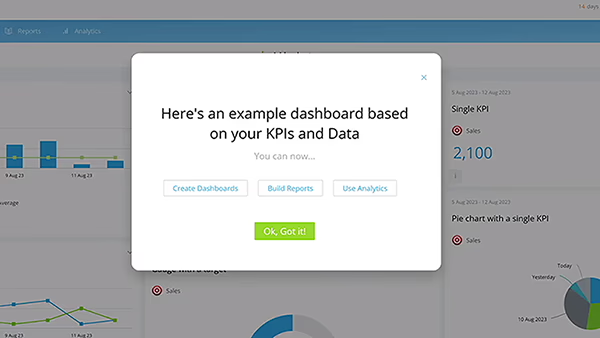
After adding data to your KPI, you will see an example dashboard that SimpleKPI has automatically generated for you. A dashboard is a visual representation of your KPIs that allows you to monitor and analyze your performance at a glance.
You can customize this dashboard or build your own from scratch. To customize or build your dashboard, follow these steps:
- Click on the add a chart icon on the top of the dashboard.
- Click the chart type you wish to add, hovering over the chart types will show more information on the chart.
- Adjust the settings, such as KPI, date range and colours.
- Click "save"
- Once the chart is added to the dashboard you can position it by clicking and dragging on the charts top bar.
5. How to create and share reports
After adding data to your KPI, you will see an example dashboard that SimpleKPI has automatically generated for you. A dashboard is a visual representation of your KPIs that allows you to monitor and analyze your performance at a glance.
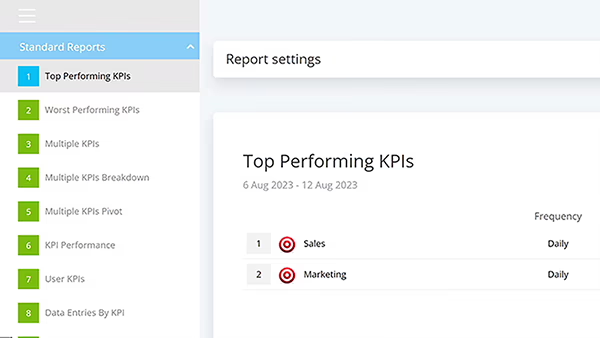
To create a report, follow these steps:
- Click on the "Reports" tab on the top menu bar.
- Click the Reports setting menu to access the report settings.
- Adjust the settings, such as KPI, date range, filters and colours.
- Once the report is created you can save by clicking on the "save" icon in the top right menu bar.
To share a report, follow these steps:
- Click on a saved report.
- Click on the share icon in the top right of the menu.
- Adjust the settings, to share via a public link, or within the application to different users and groups.
- Click "share"
6. How to customize and manage your account
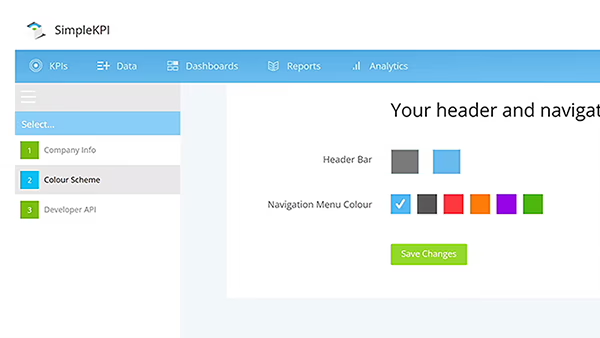
SimpleKPI gives you full control over how you want to use and manage your account. You can customize the look and feel of SimpleKPI by going to the "Manage My - Settings" options. Here you can change the colors, logos, language, financial date settings, and domain name of your account.
You can also get support from our team by clicking on the support icon on any screen. This opens a message window where you can send us your issue. We will respond within 24 hours via email, but most issues are resolved within a few hours.
You can also manage your subscription by going to the “Manage My - Billing” options. Here you can see your current plan, billing history, and payment methods. You can also upgrade, downgrade, or cancel your subscription at any time.
Frequently Asked Getting Started Questions
If you have more getting started questions, you can visit our FAQ page or our support portal for more information.
You can take a trial by visiting app.simplekpi.com/trial. The trial is free for 14 days and contains all the features. Once you're happy with the software, you can subscribe anytime by clicking the subscribe button.
Yes, you can upload an Excel spreadsheet for your Data and KPIs. You can also link to a Google Sheets containing your data to automatically update your data on SimpleKPI.
Yes, you can automatically integrate with over 2000+ applications via the Zapier integration.
When sharing a dashboard you can also generate a link you can send so that anyone can view the dashboard without having to login to your account.