
Bridging the Gap Between Strategy and Action
Let’s be real—most businesses set big, ambitious goals but struggle to connect them to everyday actions. It’s like trying to build a skyscraper without a blueprint. Sure, you have the vision, but how do you make sure every brick (or in this case, every team and employee) is contributing to the bigger picture?
That’s where the KPI Pyramid comes in. It’s a powerful framework that ensures your high-level strategy doesn’t get lost in the day-to-day grind. By structuring KPIs from top-level objectives down to frontline tasks, you create a seamless flow from strategy to execution.
Here’s the key point: Companies that align their teams with strategic goals are 50% more likely to achieve them. The KPI Pyramid makes this alignment easy. In this guide, I’ll break it down for you—step by step—so you can apply it to your business .
What is the KPI Pyramid?
Most businesses track Key Performance Indicators (KPIs), but many struggle to connect them in a meaningful way. Some focus too much on high-level goals and lose sight of daily execution. Others get lost in low-level tasks without a clear connection to company success.
The KPI Pyramid fixes this. It’s a structured framework that aligns every metric with business strategy—from top-level company objectives down to individual tasks. When done right, it ensures that everyone in your organization is working toward the same goals.
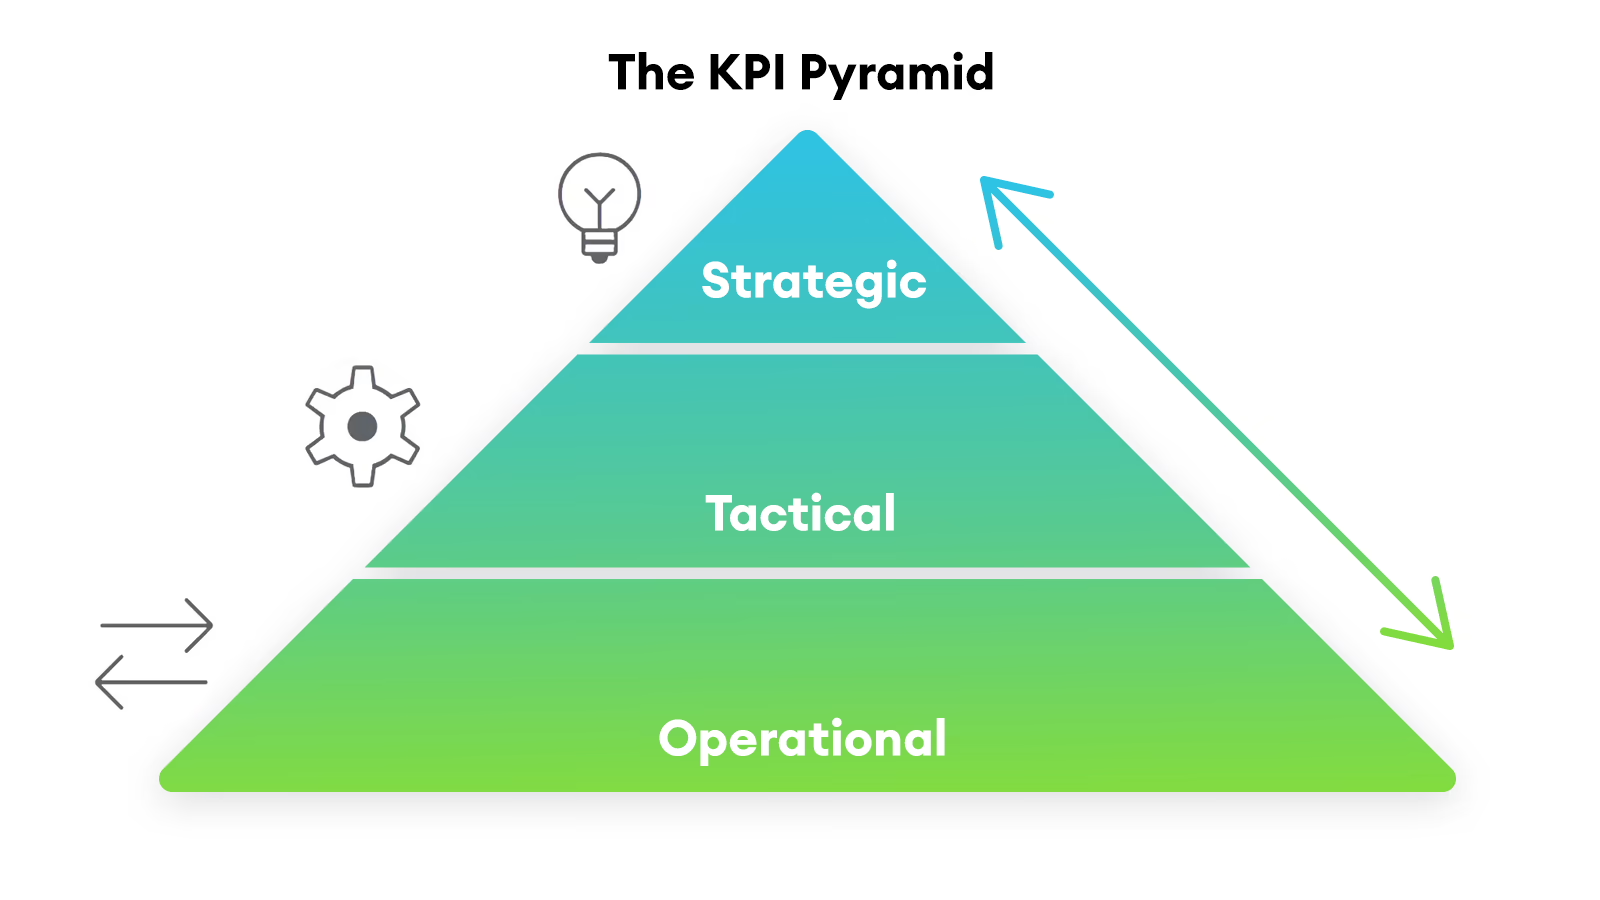
The KPI Pyramid is built on three levels:
- Strategic KPIs (Top Level) – These focus on big-picture business objectives.
- Tactical KPIs (Middle Level) – These measure department and team performance.
- Operational KPIs (Bottom Level) – These track daily tasks and individual contributions.
When KPIs at each level are aligned, decision-making becomes clear. Progress is measurable. And best of all? Every action directly impacts success.
Breaking Down the KPI Pyramid: The Three Layers
1. Strategic KPIs (The Top Level)
This is where the big goals live. Strategic KPIs define long-term success and guide the company’s direction. They’re high-level, broad, and focused on overall business health.
Who Uses Them?
Executives, C-level leaders, and decision-makers.
Examples:
- Revenue Growth Rate – Tracks how fast your company is increasing sales.
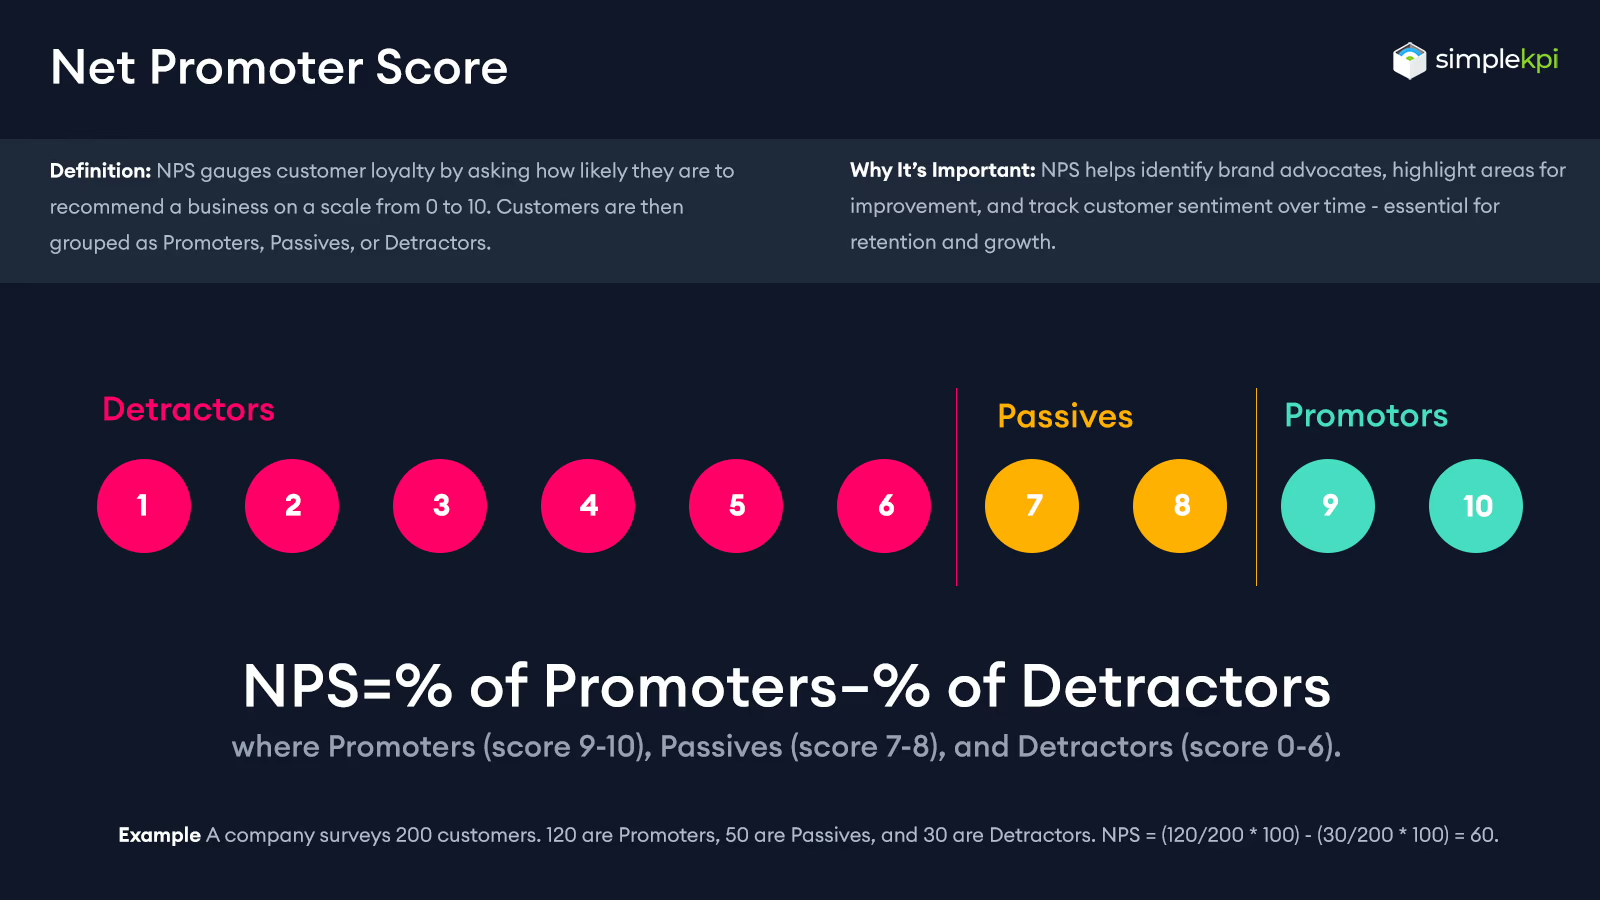
- Net Promoter Score (NPS) – Measures customer loyalty and satisfaction.
- Market Share – Shows your company’s position in the industry.
- Customer Retention Rate – Indicates how well you keep customers over time.
How to Set Them:
Your strategic KPIs should align with your company’s mission and vision. Keep them big, clear, and outcome-driven. Think year-over-year growth, not short-term wins.
2. Tactical KPIs (The Middle Level)
Now, we get into the department-level KPIs. These bridge the gap between strategy and daily operations. They help teams measure their impact and contribute to company goals.
Who Uses Them?
Department managers and team leads.
Examples by Department:
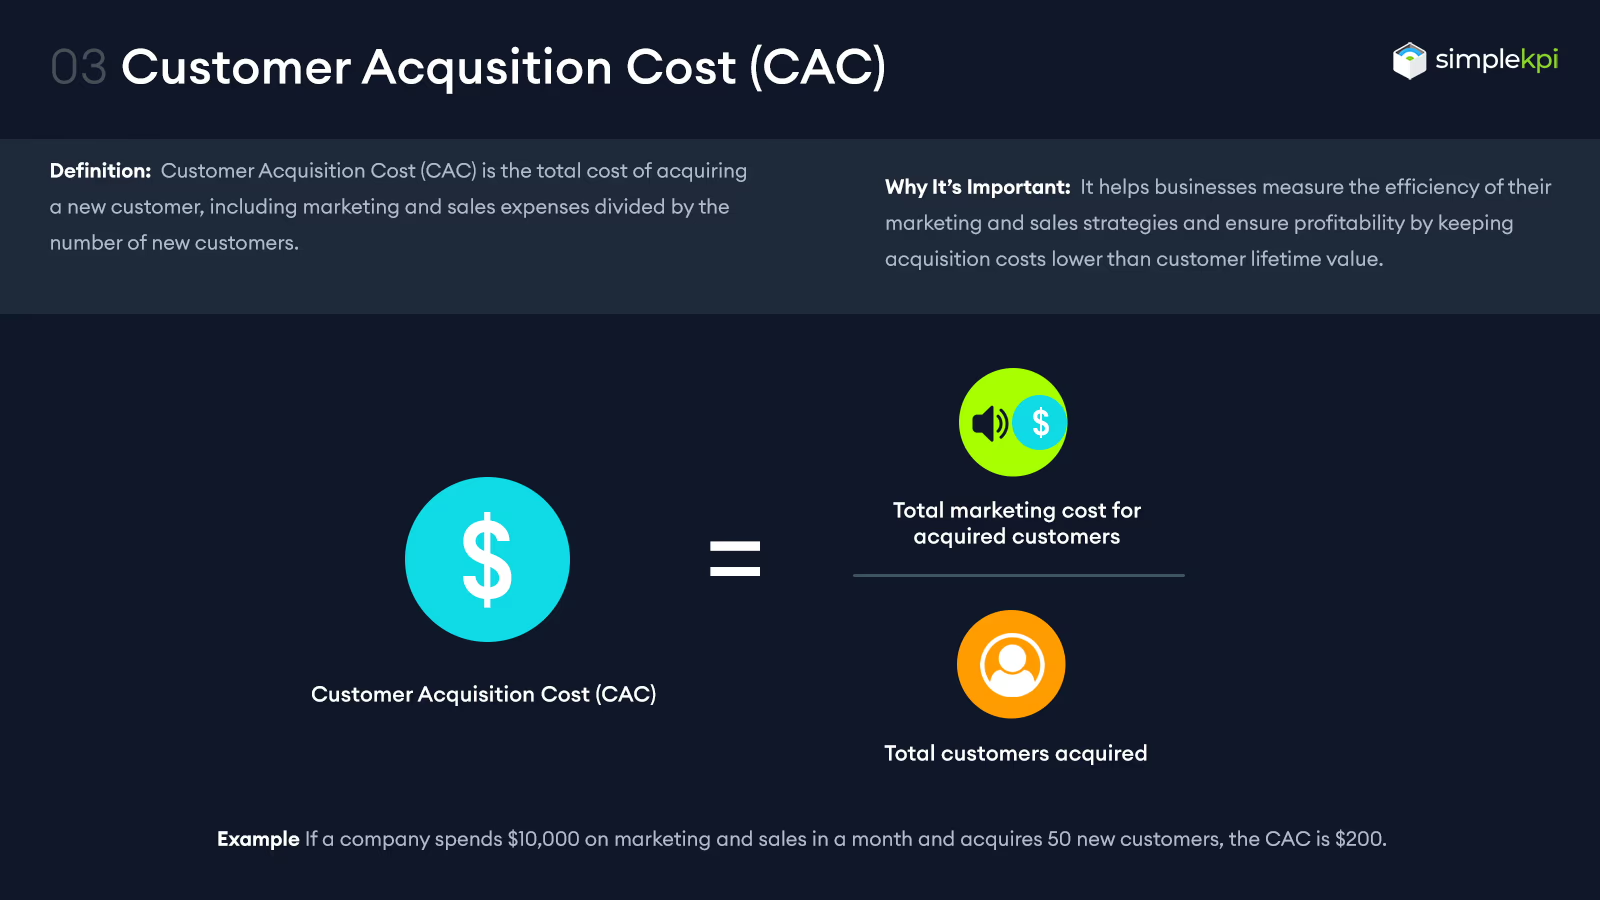
- Sales: Customer Acquisition Cost (CAC), Lead Conversion Rate.
- Marketing: Website Traffic, Social Media Engagement.
- Operations: Supply Chain Efficiency, On-Time Delivery Rate.
How to Set Them:
Tactical KPIs should connect directly to strategic goals. For example, if your strategic goal is to increase revenue, your tactical KPI might be to improve lead conversion rates by 15%.
3. Operational KPIs (The Bottom Level)
Here’s where the daily grind happens. Operational KPIs track real-time activities and performance at the individual level.
Who Uses Them?
Frontline employees and team members.
Examples:
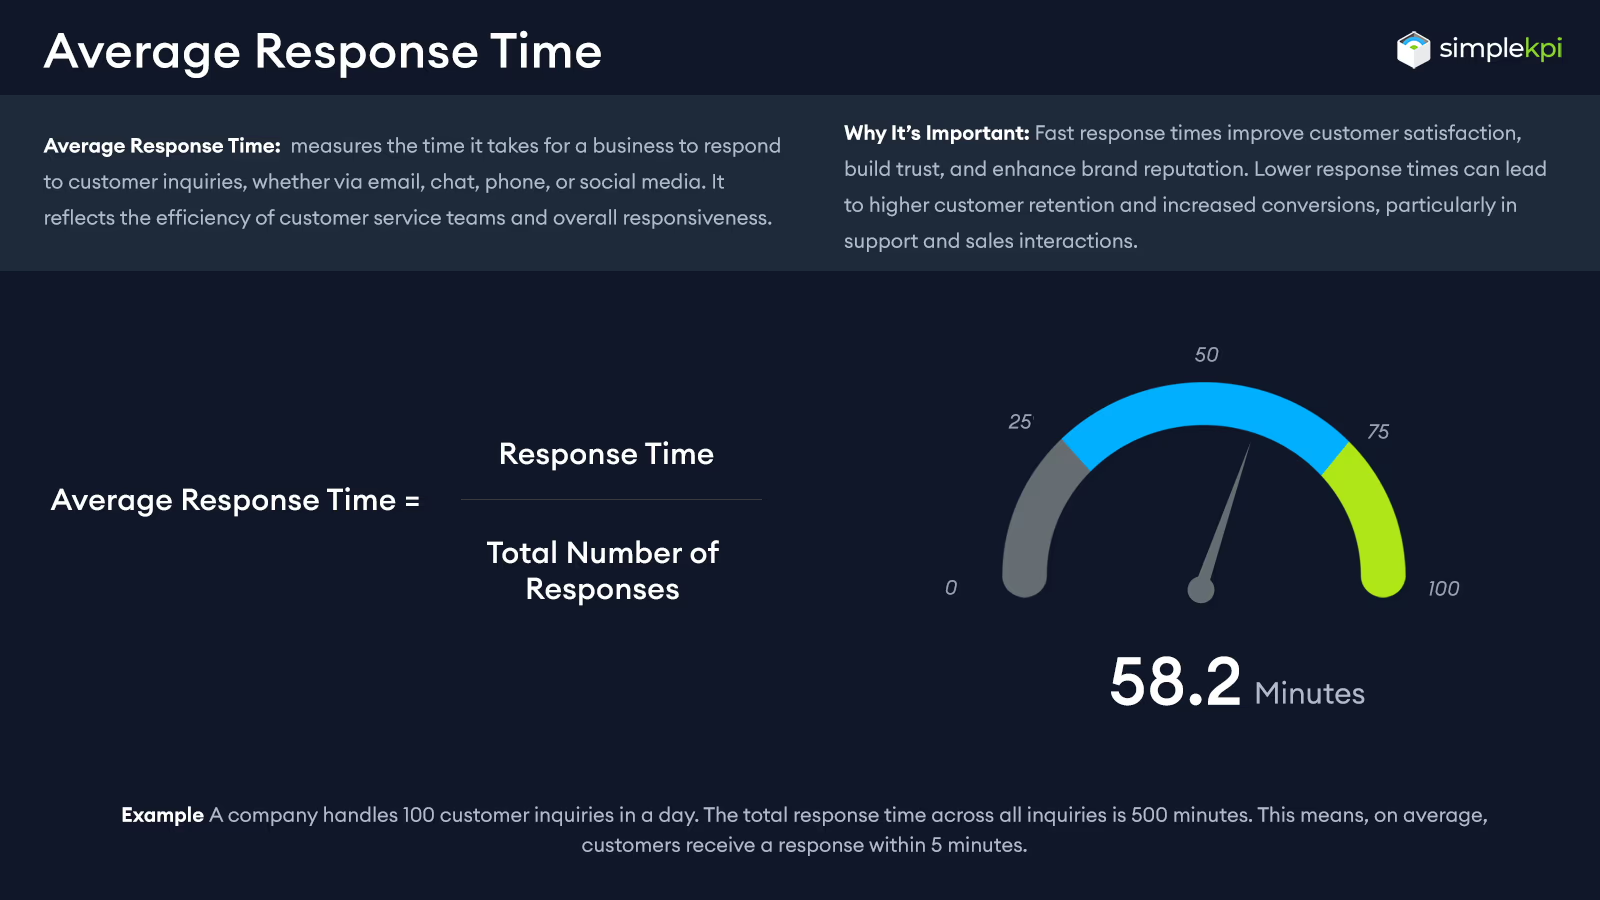
- Customer Support: Average Response Time, First Call Resolution Rate.
- Sales Reps: Number of Calls Made per Day, Emails Sent.
- Manufacturing: Units Produced per Hour, Defect Rate.
How to Set Them:
Operational KPIs should be actionable and within an employee’s control. If a KPI isn’t tied to a clear action, it’s not useful.
How to Align KPIs at Every Level
A KPI Pyramid only works if everything is aligned. And building a KPI culture goes a long way in making sure your KPIs connect at every level:
Step 1: Define Your Strategic Goals
- Pick your top 3-5 long-term objectives.
- Example: Increase revenue by 20% in the next year.
Step 2: Create Tactical KPIs That Support These Goals
- Identify which departments contribute to this goal.
- Example: Marketing team KPI → Increase lead conversion rate by 15%.
Step 3: Set Operational KPIs for Daily Actions
- Break tactical KPIs into small, measurable tasks.
- Example: Sales team KPI → Each rep must make 50 calls per week.
Step 4: Use a KPI Dashboard to Track Progress
- Visualizing KPIs ensures alignment and helps you spot issues early.
- Example: A Sales KPI dashboard tracking calls per rep (Operational KPI), lead conversion rate (Tactical KPI), and revenue growth (Strategic KPI).
Real-World Example: KPI Pyramid in Action
Let’s say you run an e-commerce store. You want to increase revenue and boost customer retention. Here’s how the KPI Pyramid would work for you:
1. Strategic KPI (Top Level)
Goal: Increase revenue by 20% in 12 months.
2. Tactical KPI (Middle Level)
Marketing KPI: Improve website conversion rate from 2.5% to 3.5%.
3. Operational KPI (Bottom Level)
Customer Service KPI: Ensure each rep responds to 100 inquiries per day to reduce abandoned carts.
When structured this way, every action drives real business growth. Here's what an E-commerce KPI Dashboard with the relevant level KPIs would look like.
Common Pitfalls and How to Avoid Them
Even the best KPI strategy can fail. Here are three mistakes you need to avoid:
❌ Too Many KPIs
Tracking too much? You’re tracking nothing. Focus on a handful of key metrics that truly matter.
❌ Misaligned Metrics
A sales team tracking website traffic? A marketing team measuring production costs? If KPIs don’t fit the team, they won’t work.
❌ Lack of Actionability
If employees can’t directly impact a KPI, it’s useless at their level. Keep operational KPIs tied to real actions.
Final Thoughts
KPIs aren’t just numbers on a dashboard. They’re the foundation of smart decision-making. By structuring KPIs into strategic, tactical, and operational levels, you create alignment. Every team knows what to track. Every action contributes to business success.
So, take a moment to assess your current KPIs. Are they clear? Actionable? Aligned? If not, it’s time to build your KPI Pyramid and start tracking what really matters!

by Stuart Kinsey
Stuart Kinsey writes on Key Performance Indicators, Dashboards, Marketing, and Business Strategy. He is a co-founder of SimpleKPI and has worked in creative and analytical services for over 25 years. He believes embracing KPIs and visualizing performance is essential for any organization to strive and grow.