What is an Educational Institute Dashboard
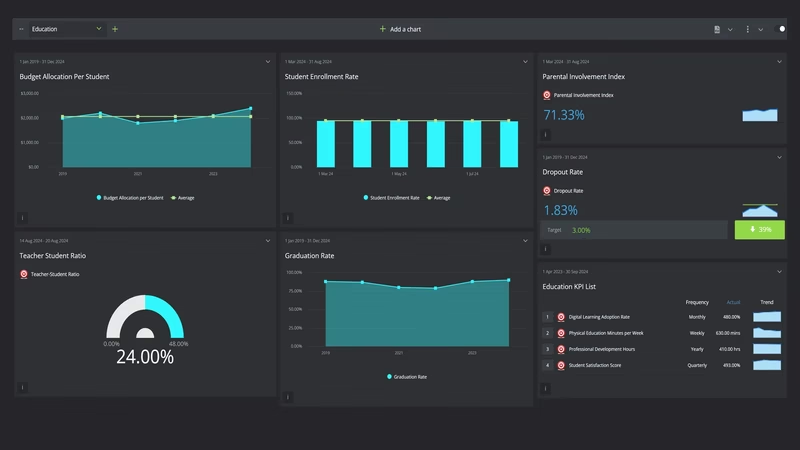
In the modern educational landscape, data-driven decision-making is becoming increasingly vital. By leveraging key performance indicators (KPIs), educational institutions can gain insights into their strengths and areas for improvement. The Education KPI Dashboard we've developed provides a comprehensive overview of the most critical metrics for schools, colleges, and universities, enabling administrators and educators to make informed decisions that enhance student outcomes and operational efficiency.
Education KPI Dashboard Overview
This Education KPI Dashboard is designed with simplicity and effectiveness in mind. It caters to the needs of school administrators, teachers, and district officials by providing a user-friendly interface that aggregates data from multiple sources. This dashboard allows users to track and analyze key metrics, helping them to maintain high standards of education and address any emerging challenges proactively.
Key Performance Indicators (KPIs) in the Dashboard
- Student Enrollment Rate: Measures the percentage of students enrolling each academic year, helping institutions track growth or identify declining trends.
- Dropout Rate: An essential metric that indicates the percentage of students who discontinue their studies before completing the program. Monitoring this rate can help schools implement retention strategies.
- Graduation Rate: Tracks the percentage of students who successfully complete their programs, serving as a key indicator of academic success.
- Average Test Scores: Provides an overview of student performance across various subjects, helping educators identify areas where students may need additional support.
- Teacher-Student Ratio: This KPI measures the average number of students per teacher, which is crucial for understanding the level of personalized attention students receive.
- Retention Rate: Monitors the percentage of students who continue their studies from one academic year to the next, indicating the institution's ability to engage and retain students.
- Budget Allocation per Student: Tracks the amount of financial resources allocated per student, allowing for better budget planning and resource distribution.
- Parental Involvement Index: Measures the level of parental participation in school activities, which can be a significant factor in student success.
- Digital Learning Adoption Rate: Reflects the extent to which students and teachers are utilizing digital learning tools, an increasingly important aspect of modern education.
- Physical Education Minutes per Week: Monitors the amount of time students spend in physical education, which is vital for their overall well-being.
- Student Satisfaction Score: Provides insight into how satisfied students are with their educational experience, which can influence retention and success rates.
- Professional Development Hours:Tracks the amount of time teachers spend on professional development, ensuring they stay up-to-date with the latest educational practices.
Benefits of Using an Education KPI Dashboard
By using this Education KPI Dashboard, institutions can significantly enhance their decision-making process. The dashboard enables real-time monitoring of critical metrics, helping schools and colleges respond swiftly to any issues. It also supports better resource allocation, ensuring that funds are used where they are needed most. Moreover, by tracking student performance and satisfaction, educators can implement targeted interventions to improve outcomes.
Features of the Education KPI Dashboard
Our dashboard is designed with a focus on ease of use and customization. It features an intuitive interface that allows users to quickly access the data they need. The dashboard includes various visualization tools such as graphs and charts, making it easier to interpret complex data. Additionally, the dashboard can be customized to meet the specific needs of any educational institution, and it integrates seamlessly with existing school management systems.
