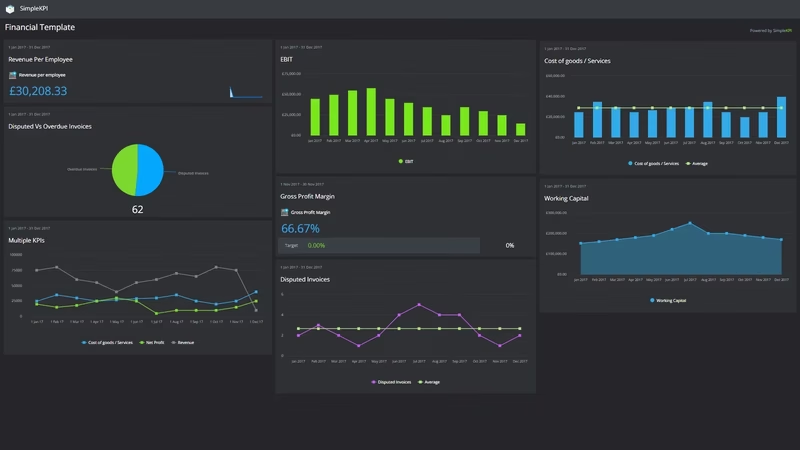
What is a financial dashboard?
A financial dashboard is a reporting tool that displays a summary of related Key Performance Indicators and Metrics. These dashboards can condense large amounts of data into a single visual representation, often in the form of graphs and charts for a quick overview of financial performance.
Overview
There are various ways financial performance can be monitored, from traditional balance sheets to more complex forecast models, and more increasingly dashboards. Nearly every aspect of a business contributes to the financial success in terms of profit margins and growth. By focusing on financial ratios, you can uncover areas of the business that are having a detrimental impact on the revenue figures, and then focus on key factors to improve the financial position.
Monitoring ratios such as, the remaining revenue after deducting the cost of goods sold (gross profit margin), the capital of the business which is used for the day to day activities minus the current liabilities (working capital) - alongside semi-financial indicators such as revenue per employee and invoices disputed can provide you with a general picture of how finance is managed across the organization, and how one area impacts the other.
These financial dashboards can quantify the financial position, performance and liquidity of a business at-a-glance. They are a valuable tool in monitoring the financial position without having to wait for reports or audits to uncover potential issues affecting a company’s growth.
Who is this dashboard for?
This template was created for Financial Managers and related departments, especially those who may be new to tracking financial KPIs and maybe looking for a little direction on how to get up to speed fast.
