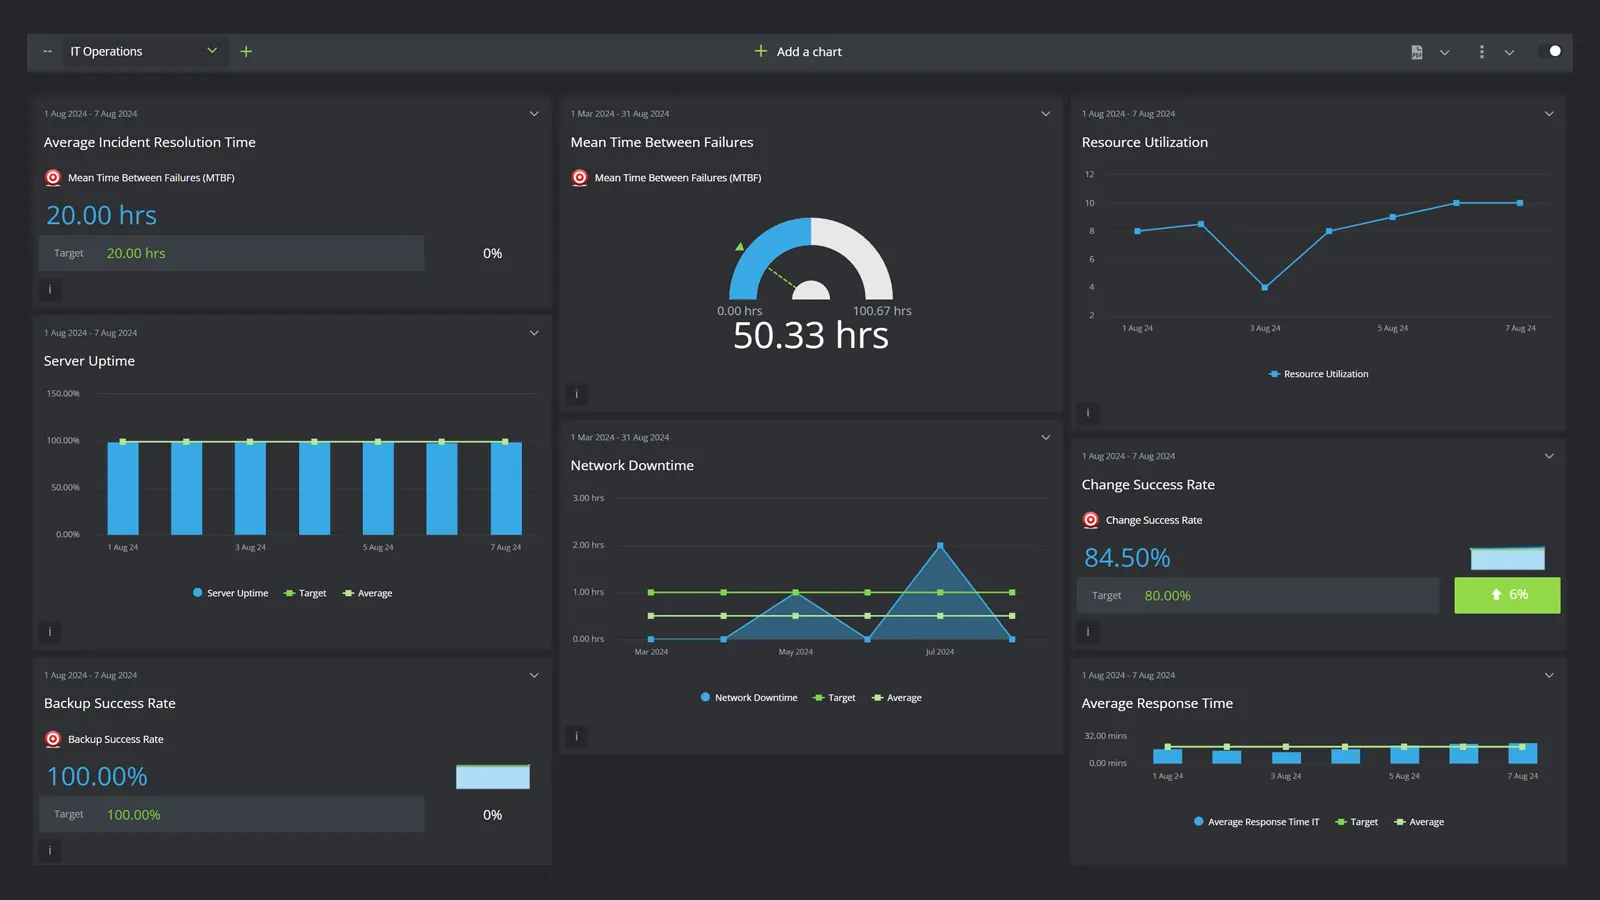
What is an IT Operational Dashboard
An IT Operations dashboard provides a unified view of critical IT service metrics. It aims to optimize system performance, ensure reliability, and facilitate quick issue resolution by tracking essential Key Performance Indicators (KPIs).
What the Dashboard is Trying to Accomplish
The IT Operations dashboard is designed to monitor and improve the efficiency, reliability, and cost-effectiveness of IT services. By providing real-time data on various IT operations, it helps identify issues, streamline processes, and enhance overall performance.
Who Should Use the Dashboard
This dashboard is ideal for IT managers, system administrators, and network engineers. It serves anyone responsible for maintaining the health and performance of IT systems, enabling them to make data-driven decisions to improve service delivery.
Breakdown of KPIs Used in the Dashboard
Server Uptime
Measures the reliability and availability of servers.
Incident Resolution Time
Tracks the speed of resolving IT incidents
Mean Time Between Failures (MTBF)
Indicates the average time between system failures.
Backup Success Rate
Monitors the success rate of data backups.
Resource Utilization
Evaluates how effectively IT resources are being used.
Change Success Rate
Measures the success rate of implemented changes.
Network Downtime
Tracks periods when the network is unavailable.
Average Response Time IT
Measures the average response time to IT issues.
Patch Compliance
Tracks adherence to software patching schedules.
Hardware Failure Rate
Monitors the frequency of hardware failures.
Software License Compliance
Ensures compliance with software licensing agreements.
IT Cost Per User
Measures the cost efficiency of IT services per user.
